

Table of Contents
I manage my money and track all my personal finances in just 5 minutes a week.
And if you’re someone who’s interested in making more, spending less, and having 100% transparency of what you’re doing with your money, then I highly recommend you begin tracking your finances too.
To help you get started, you can download the exact template I use for FREE by signing up to my weekly newsletter:
Once you’ve confirmed your email, you’ll be directed to the template. Feel free to unsubscribe from my newsletter at any time! 😁
💰 Why I Track My Money Manually
Now, I know that some of you probably already use some sort of finance or budget tracking tool already e.g. Credit Karma
And, to be honest, this is exactly what I used to do too.
But, after trying out a bunch of different apps, I’ve found that I’d much rather just track everything myself for a few different reasons:
- First, my data is better protected. If I track everything myself, I don’t have to share any personal information (like my name, email, and bank details) with anyone. Plus, these apps are prone to being shut down (such as Mint, which was shut down earlier this year despite having millions of active users)
- Second, I’ve found that tracking my own expenses and income forces me to consider my financial picture on a regular basis. This has made me a lot more proactive about spotting trends and identifying savings opportunities.
- Third, I have full customisation of how the information is presented and I can save all of this transaction data in one place, which often isn’t possible using other apps as many banks only let you access your transaction data from the past 12 months (or less)
- And, finally, building my own thing is completely free and will always remain so.
📂 Categories
Let’s now take a closer look at the tracker.
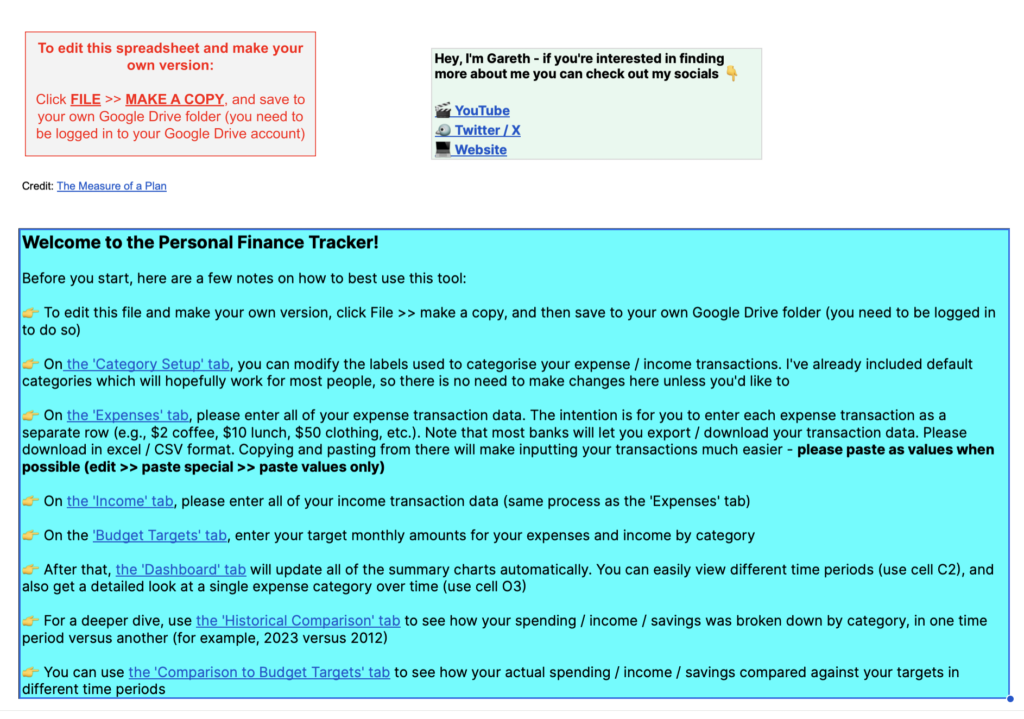
When we first click on the link to access this template, we’ll be shown this screen which will give you a bit more information about how to use it and how to make a copy.
All we need to do is click ‘file’ then ‘make a copy’ and we should be pretty much good to go.
Once this is done, the first thing we want to do is hop over to the ‘categories’ sheet at the bottom of the page.
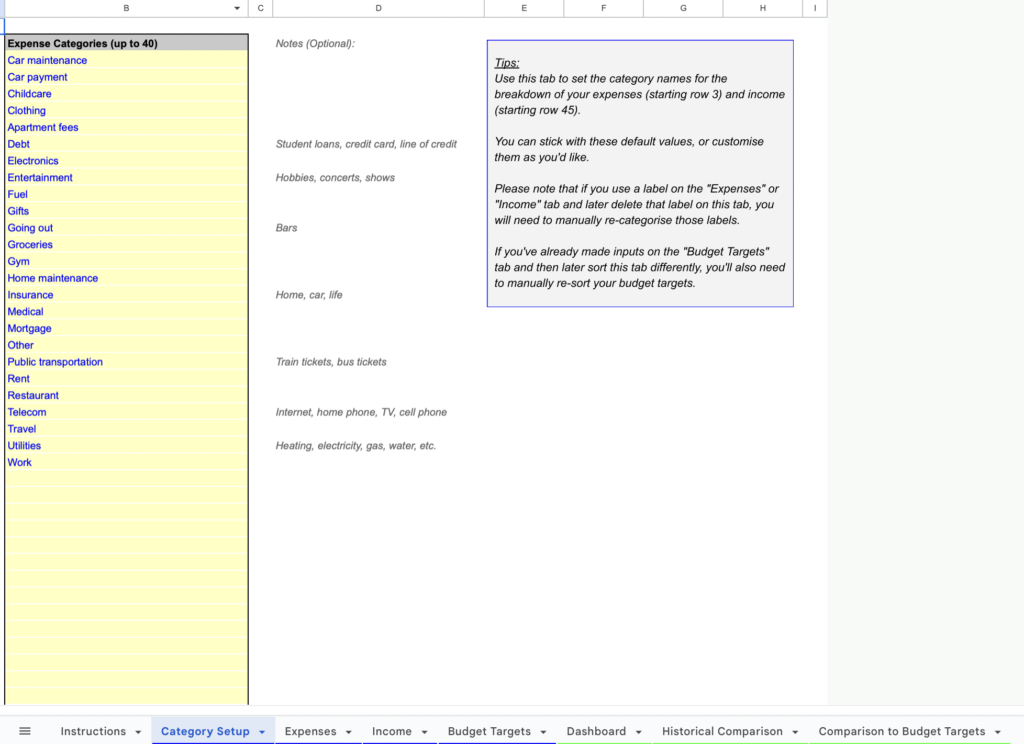
The basic idea here is that all the money that comes into or out of our bank account can be grouped into a few different categories.
Now, I’ve already included some default expense and income categories which probably work for most people, so there’s no need to make any changes here unless we’d like to.
For example, we have things like clothing, groceries, public transportation and rent as expense categories. And things like our job and side projects as income categories.
But, if you want to change any of these category names you’re more than welcome to do so and you can add new categories below within the yellow box too.
And, then there’s also a column to add any optional notes if we want to remember any specific details about the category. For example, under the category ‘Travel,’ we might want to note whether this includes just day-to-day commuting or leisure travel as well.
I highly recommend getting these categories right from the start because they are the foundation of how our finances will be tracked and analysed across the other sheets in the template, including the expenses and income sheets which we’re going to take a look at now.
💵 Income and Expenses
The income and expenses sheet is where we’ll need to spend most of our time when managing our personal finances as it’s where we’re going to list the money coming into or out of our bank account.
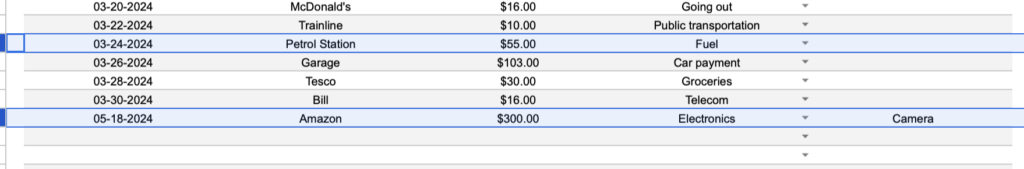
In the ‘expenses’ sheet then, I’ve already put together an example of what this should look like. But, in short, we want to use this sheet to enter all our expenses with each transaction taking up a separate row.
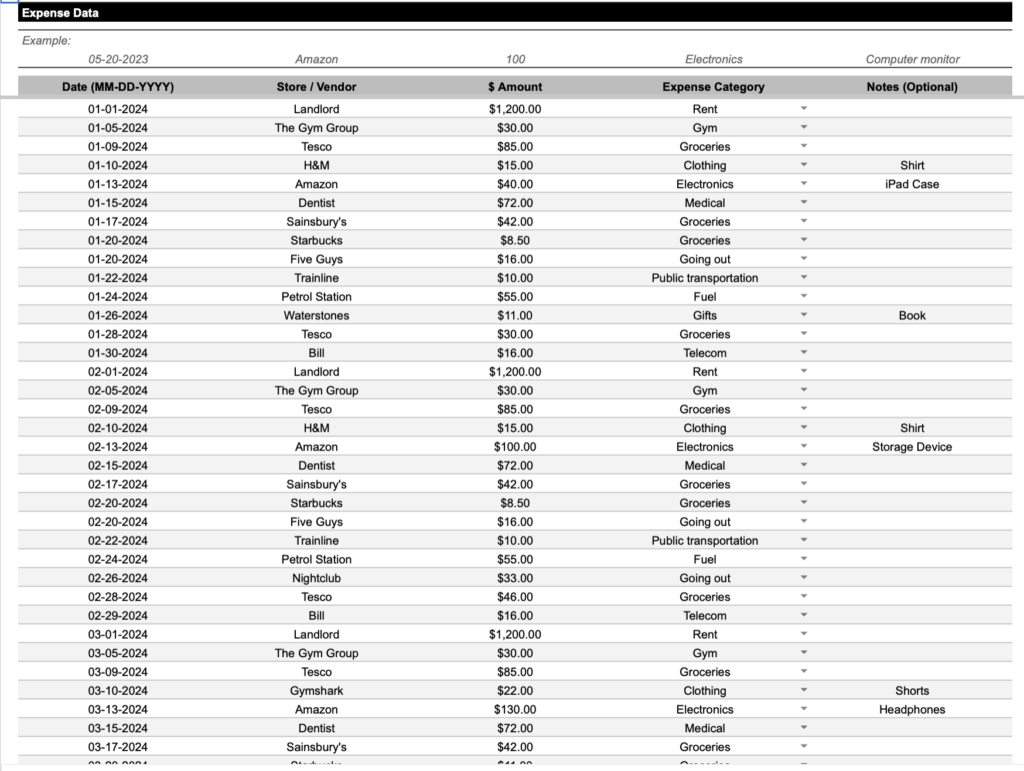
For example, let’s say that today we bought a new camera from Amazon. We’d select today’s date, enter the store as ‘Amazon’, write down the price of the camera (let’s just say it was $300), give it a category (which is being pulled from our list of categories above), and then we can give it an optional note too.
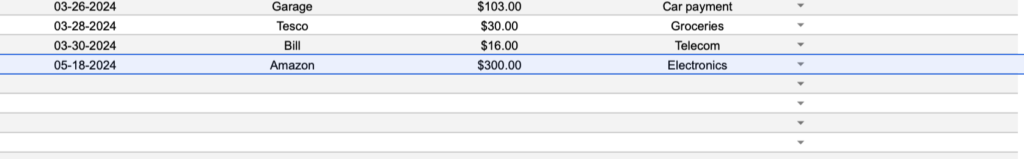
I like to add an optional note if the thing I’m buying is not immediately obvious from the other fields I’ve filled in. So, using the camera example – it’s not that obvious the thing I’ve bought is, in fact, a camera, so I’ll write ‘camera’ in the notes column. But other transactions, like when I’ve bought fuel or gone to Starbucks are more obvious so I’ll leave the note section blank.
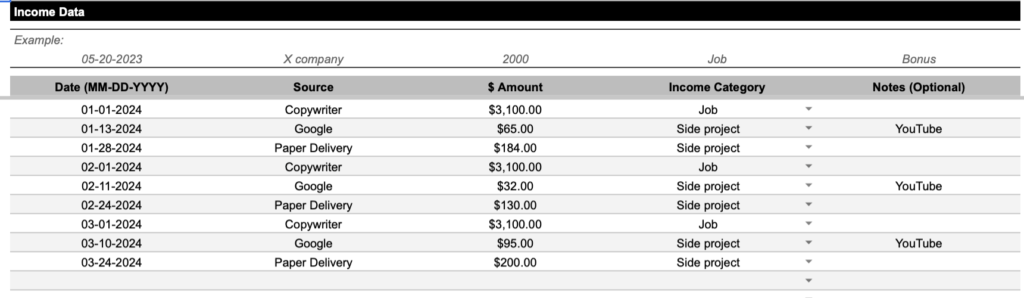
The ‘income’ sheet then follows the exact same process.
For example, if we’re a copywriter earning $3100 per month or do a paper delivery round once a week, we can enter that income as a new line.
There is a way we can download a CSV of all our transaction from our bank account and paste it directly into this sheet, if we want to make this process even faster, but I personally prefer reviewing and entering every transaction one by one so I know exactly what I’m doing with my money.
And, honestly, this process doesn’t take very long at all.
I spend about 5 minutes every Sunday reviewing and entering the transactions from the previous week, and that’s it. But you’re more than welcome to fill in this information once a day or once a month or at whatever cadence feels best for you – either way, this template is purposefully designed to be as simple and straightforward to manage as possible.
🎯 Budget Targets
The final thing we need to do, before we can start looking at the data – which I think is the coolest part of this template – is to set some budget targets.
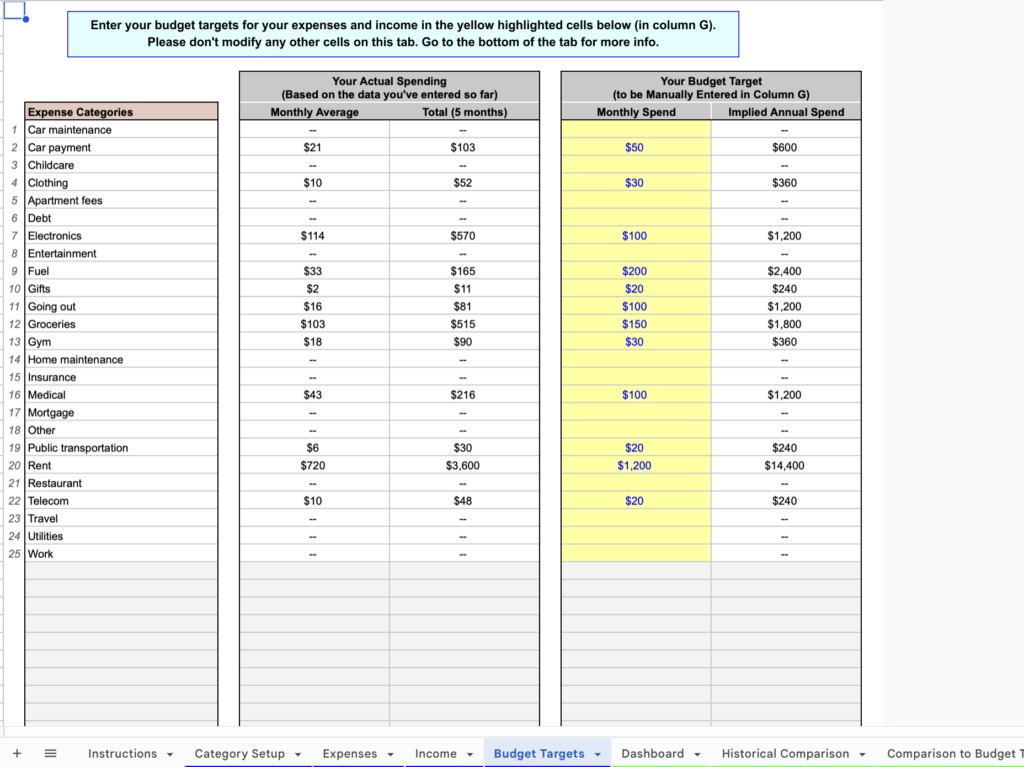
Now, using this sheet is technically optional. But I’ve found that using it is super helpful to keep my spending within a pre-determined limit and, if I ever over-spend, then this gets flagged to me straight away.
All we need to do is fill in the yellow column with a budget or amount of money we’d be happy to spend for each of our expense categories. For example, we might only want to spend $30 per month on clothes or $150 per month on groceries.
The sheet will then tell us on the right here how much we’re expected to spend every year based on the monthly budget we just set. And, over on the left, how much money we’re actually spending within each of these categories.
So, for example, we can see my budget for electronics was $100 per month, but I’ve actually spent $130 per month. So I’m technically over-budget.
We can also set budget targets for our income down below in very much the same way. For example, I might have a salary of $3100 per month so I can reasonably predict the monthly income for my job will be $3100, so we can enter that here. And again, we can see how all of that compares with my actual income on the left.
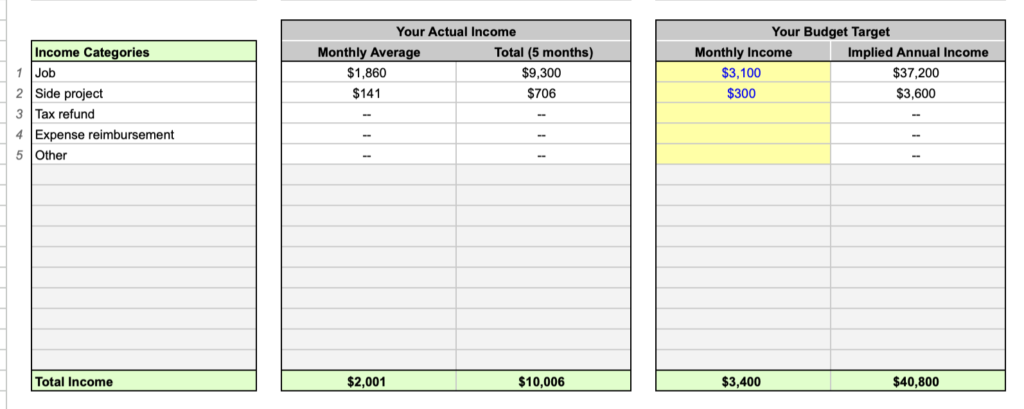
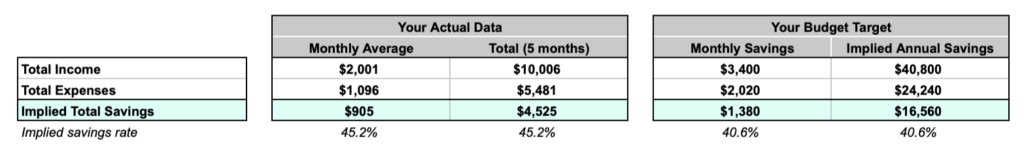
Finally, at the bottom we can see a summary of how much we’re predicting to spend and earn monthly and annually over on the right, which gives us an implied total of how much we’re expected to save across the year. This then can be compared to how much we’re actually saving over on the left.
So, this sheet doesn’t really need to be changed that much once we’ve filled it in. In fact, I try to set my budget targets once a year and that’s it. Which means I only need to regularly look at the income and expenses sheets that we’ve already talked about, and the data sheets that we’re going to take a look at now.
📊 Data
Having filled in all the stuff we need to manually fill in, the template will automatically gives us a tonne of very useful data about our personal finances that’s broken down into three sheets:
- The Dashboard
- The historical comparison
- And the comparison to budget targets
So let’s look at each of these in turn.
1 The Dashboard
This may initially look a little complicated, but I promise it’s very straightforward.
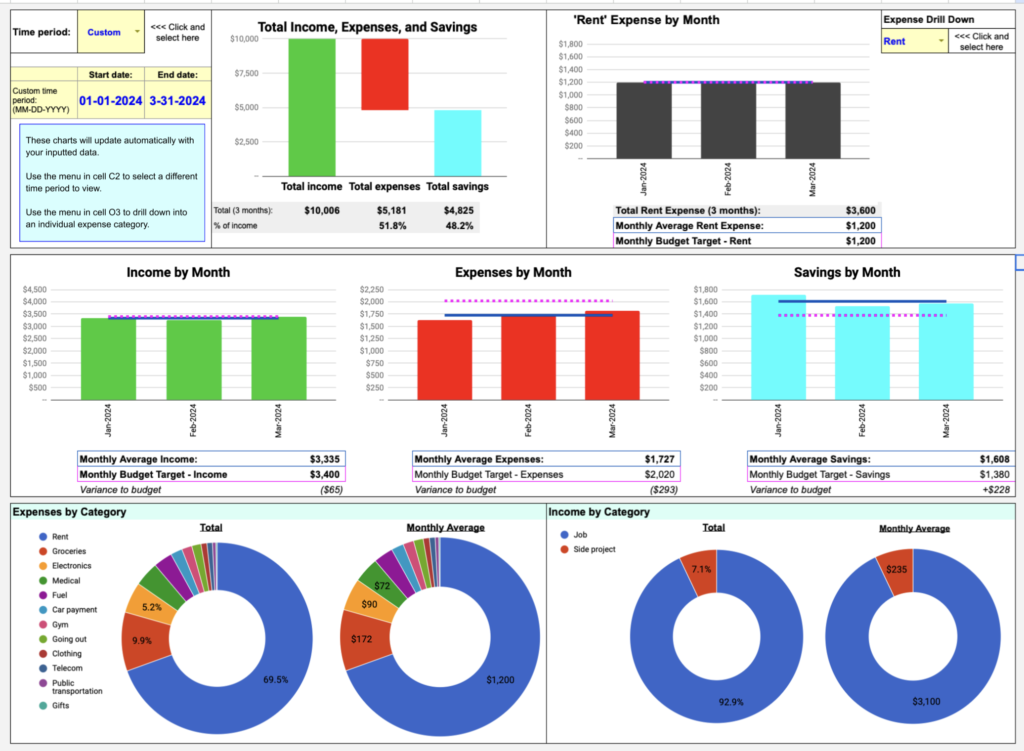
At the top we can see, at a glance, our total income, spending and savings across a certain time period. In the middle, we can see how our income, spending, and savings are changing month-on-month. And, at the bottom, we can see our overall expenses and income for a certain time period broken down by the different categories.
If we want to drill down into a single expense category we can do that in the top right corner. We just select the category we’d like to look at – such as ‘groceries’ – and we can see whether we’re spending more or less on that thing then we allowed for in our budget.
But the thing that makes this page super powerful is that we can toggle between any time period we like and all these graphs will update by themselves.
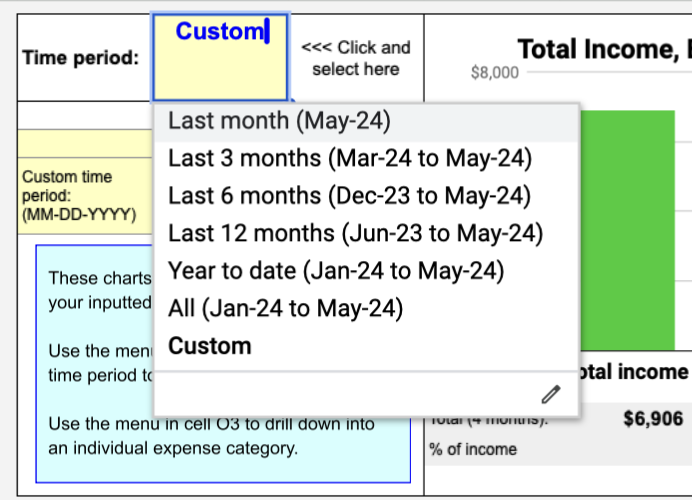
For example, right now this is showing us data from the last three months, but we can easily toggle it to to show us data from the last month, last 6 months, last 12 months, or put in some other custom time period.
Like, let’s say we want to see my personal finances from the beginning of February to the end of March. To do this, we’d just click on ‘custom’ time period, put the start date to 1 February 2024 and the end date to 31 March 2024. And, as you can see, everything is automatically updated – so this is super super powerful in my opinion and a lot of fun too.
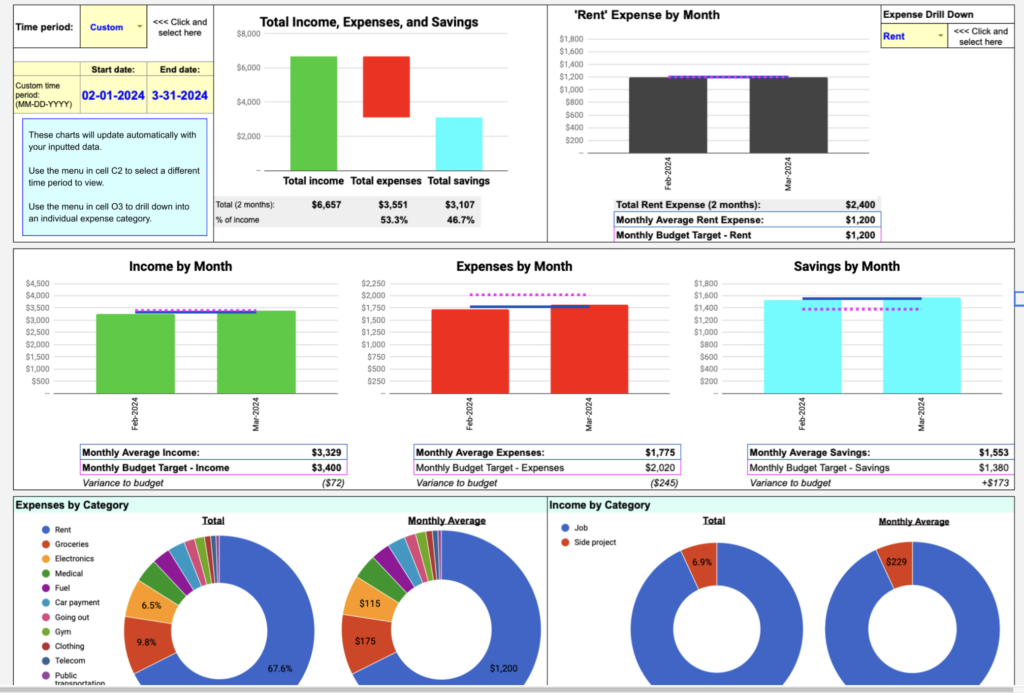
Plus, this gives you 95% of the information you’ll probably every actually need and want when it comes to managing your personal finances
The other 5% of information comes from our final two sheets, which we’ll quickly dive into now.
2 The Historical Comparison
The ‘Historical Comparison’ sheet, then, allows us to compare our income, spending and savings in one time period against another time period.
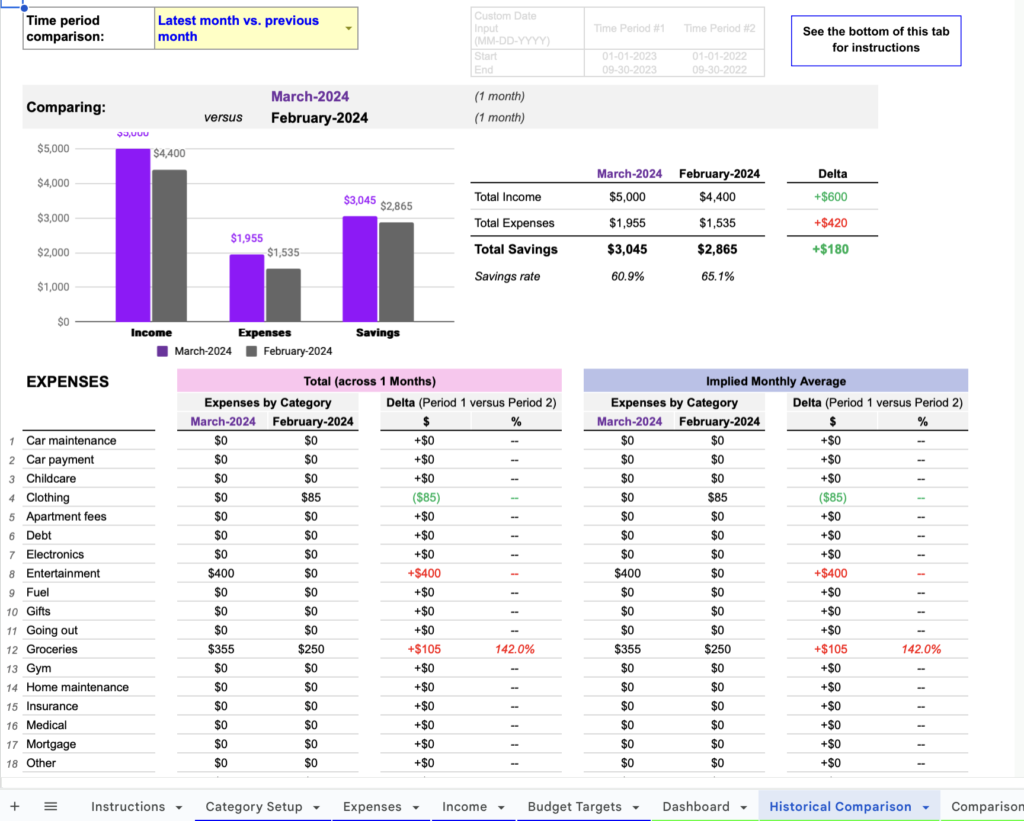
So, this sheet basically gives us a easy way to answer questions like:
- How much money did I save in total in 2024 versus 2023?
- What was my combined income in the last 6 months, compared to the same 6 months last year?
- How has my spending changed as a result of a major life event such as moving to a new city, starting to live with a spouse, etc.?
For example, here we’re comparing our finances in March versus February. We can see a breakdown of our income, expenses and savings (as per usual). Plus, this is all broken down into categories, which gives us a quick snapshot as to where our spending has decreased (in green) or where it has increased (in red).
Again, we can play around with the time periods here, and there are some default comparisons that I find cover most of the comparisons I really care about.
3 Comparison to Budget Targets
Then, finally, we have the ‘Comparison to Budget Targets’ sheet, which lets us see a summary of our actual expenses and income versus our budget targets, over any given period of time, and also shown for each individual category.
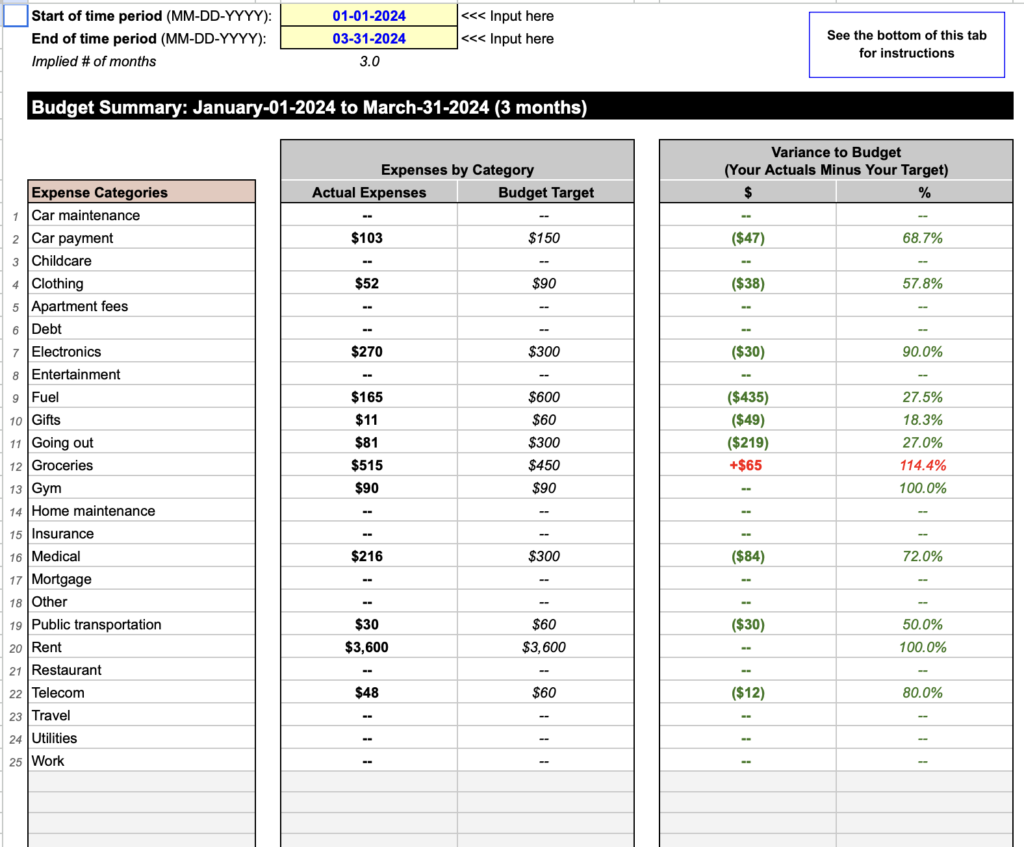
For example, we can see here that we set a $60 budget across the given time period (3 months in this case) for buying gifts. In the end, we actually only spent $11, which means we saved $49 in total in that time.
On the other hand, if we look at the income categories, we can see that we had predicted $900 of income from our side hustle, but we only actually made $706, which is $194 dollars less than where we’d hoped.
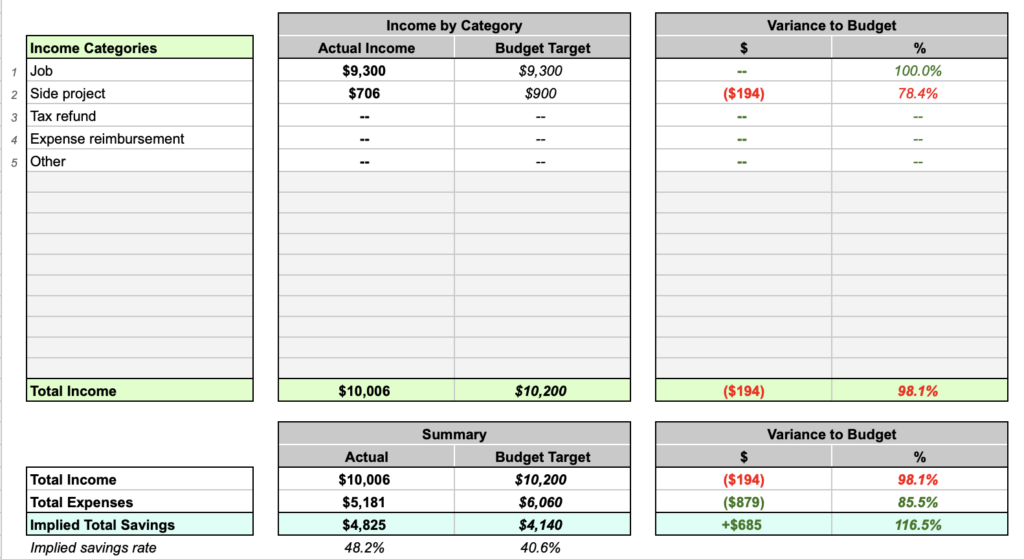
So, I find this sheet to be very useful to create an end-of-quarter or end-of-year summary of my finances, showing where each of my dollars went, and how this compared against my targeted goals.
🥳 Free Template
And that’s pretty much it.
I’ve been using this system for the last couple of years now and find it such an effortless way to track and manage my personal finances.
So, if you’re interested in doing the same, don’t forget to download this exact template below for FREE: